eth-hot-wallet
Debugging
Table of Contents
Debugging with Visual Studio Code
You can super charge your React debugging workflow with VS Code and Chrome debugging by using this launch.json config:
{
    "version": "0.2.0",
    "configurations": [
        {
            "type": "chrome",
            "request": "launch",
            "name": "Launch Chrome",
            "url": "http://localhost:3000",
            "webRoot": "${workspaceRoot}/app",
            "sourceMapPathOverrides": {
                "webpack:///./app/*": "${webRoot}/*",
                "webpack:///app/*": "${webRoot}/*"
            }
        }
    ]
}
You can read more in Live edit and debug your React apps directly from VS Code — without leaving the editor 🔥 🎉🎈
Note: There’s currently a known problem with source maps and VS Code. You can change your webpack config to use inline-source-map and the issue should be resolved.
Debugging with WebStorm
WebStorm is a powerful IDE, and why not also use it as debugger tool? Here is the steps
- Install JetBrain Chrome Extension
- Setting up the PORT
- Change WebPack devtool config to
source-map(This line) - Run web server (
npm run start) - Create Run Configuration (Run > Edit Configurations)
- Add new
JavaScript Debug - Setting up URL
- Start Debug (Click the green bug button)
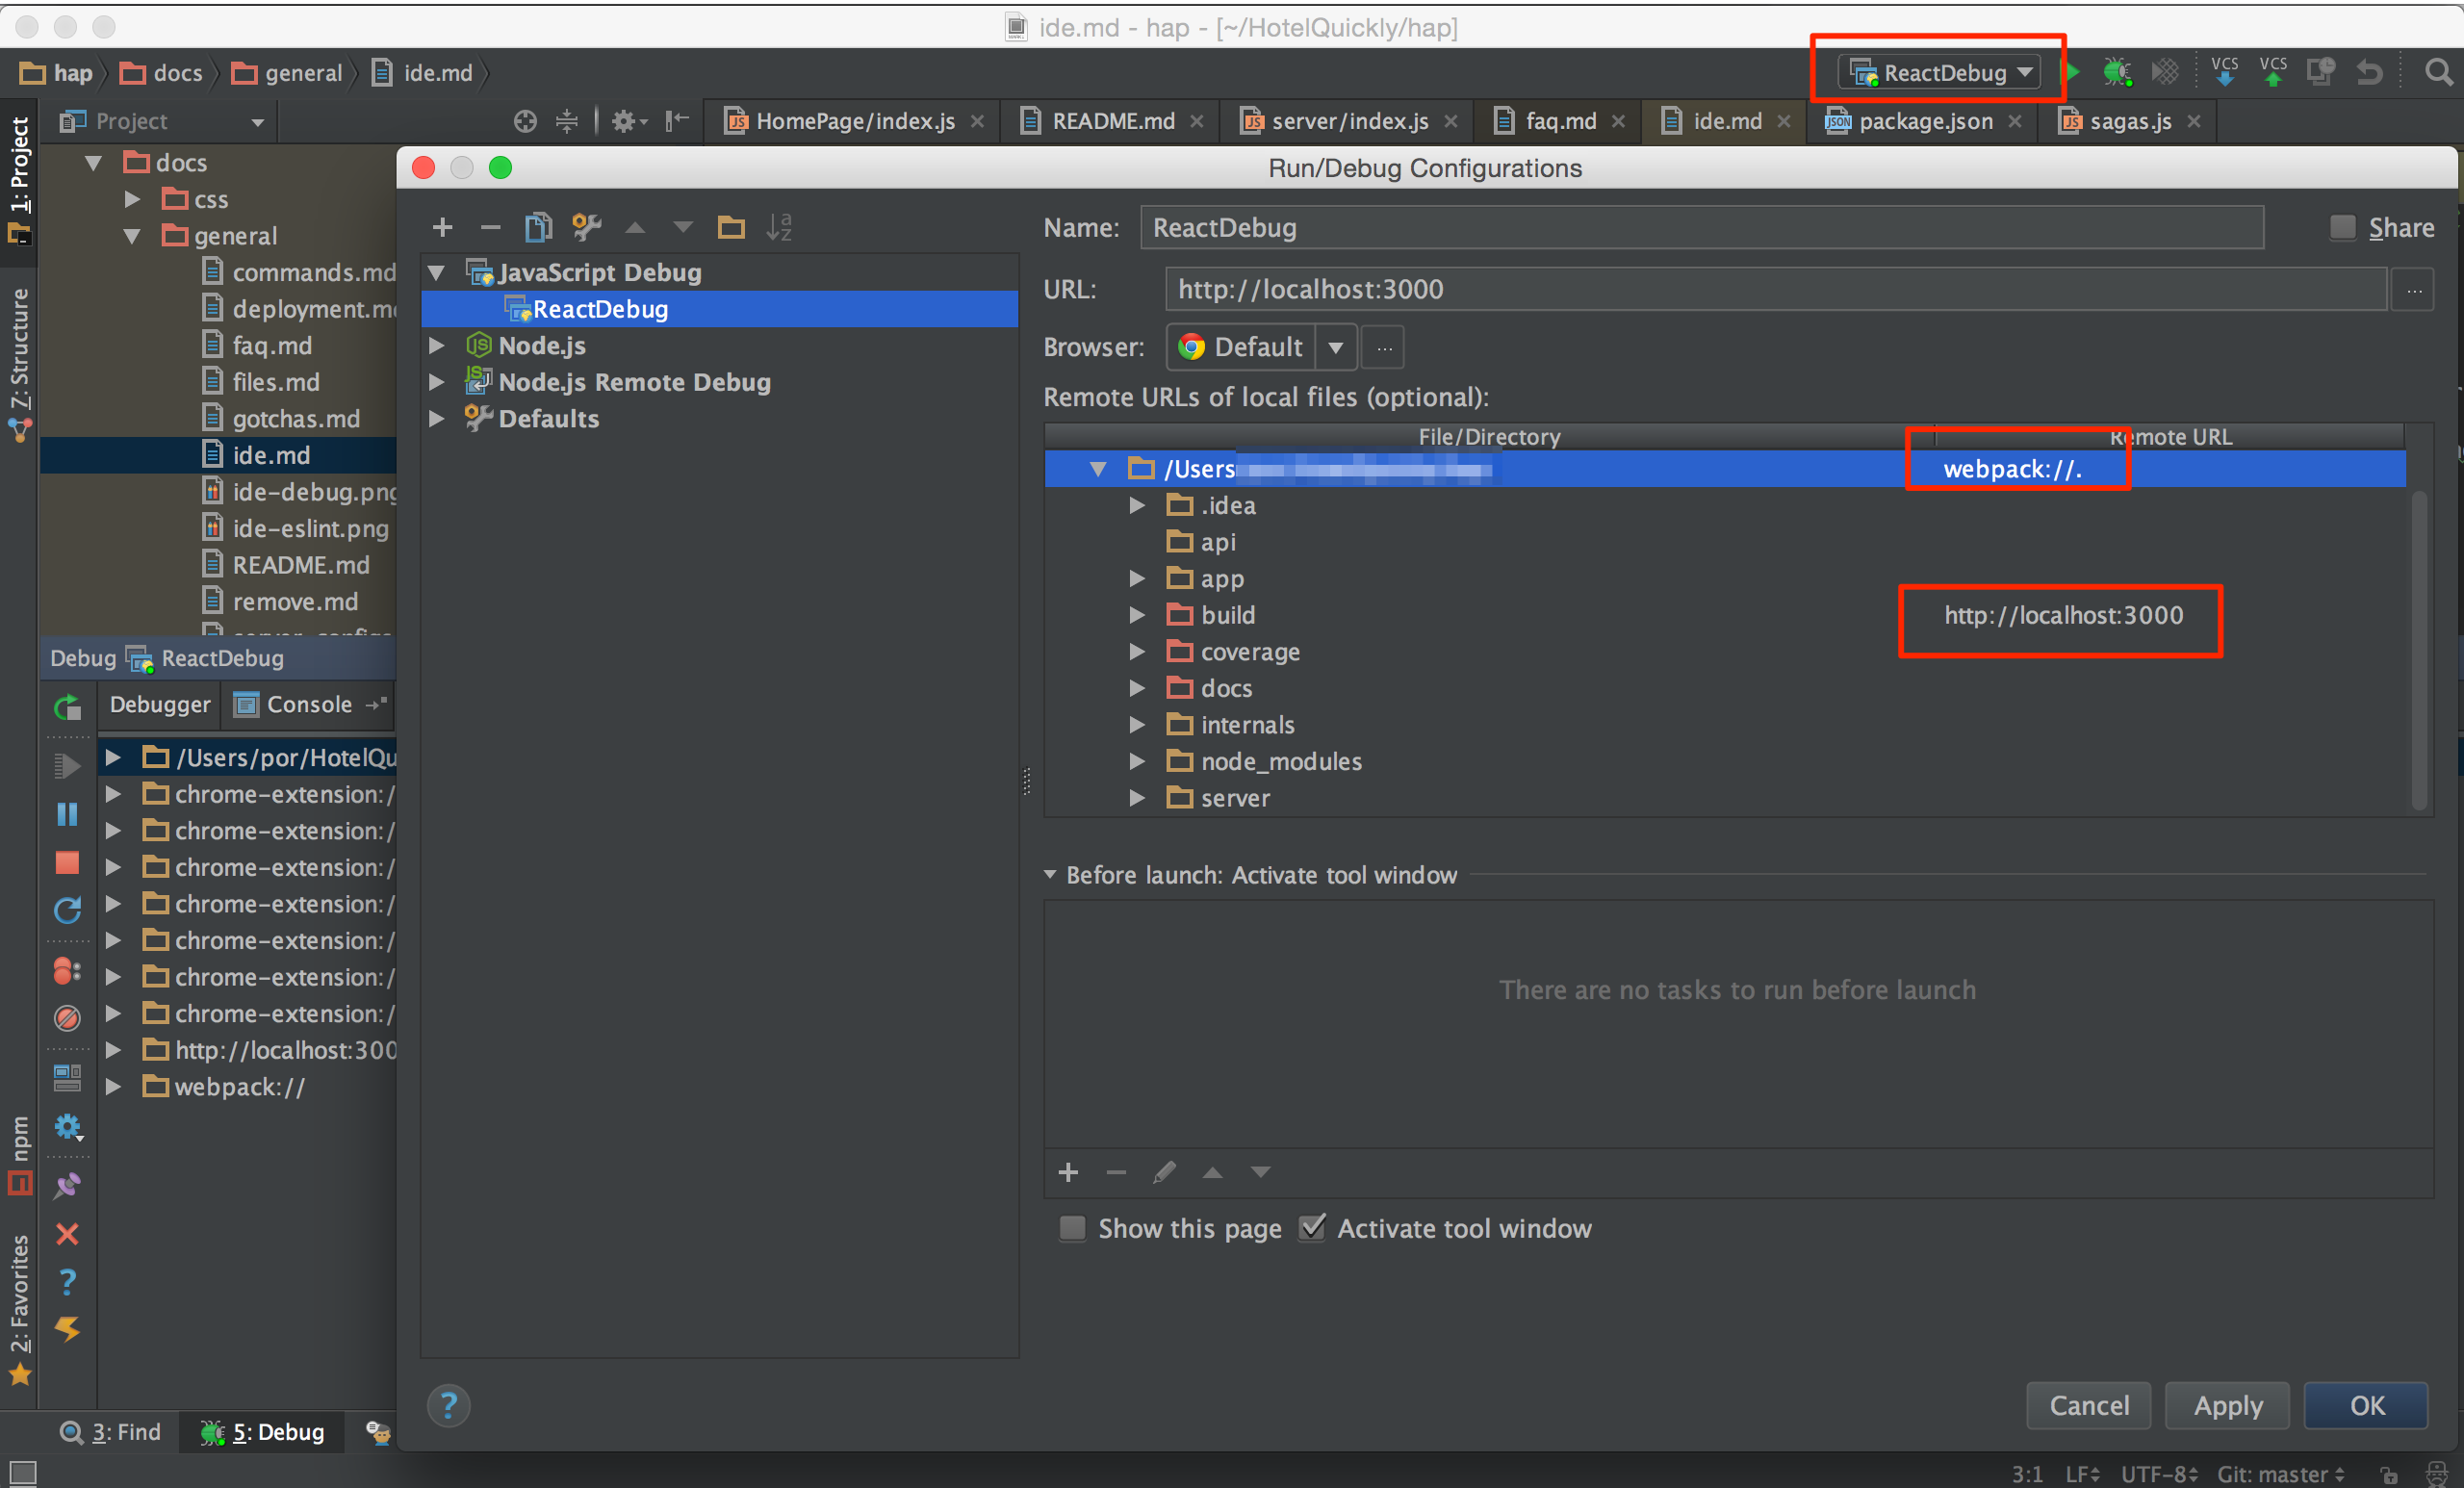
- Edit Run Configuration Again
- Mapping Url as below picture
* Map your
rootdirectory withwebpack://.(please note the last dot) * Map yourbuilddirectory with your root path (e.g.http://localhost:3000) - Hit OK and restart debugging session
Troubleshooting
- You miss the last
.(dot) inwebpack://. - The port debugger is listening tool and the JetBrain extension is mismatch.
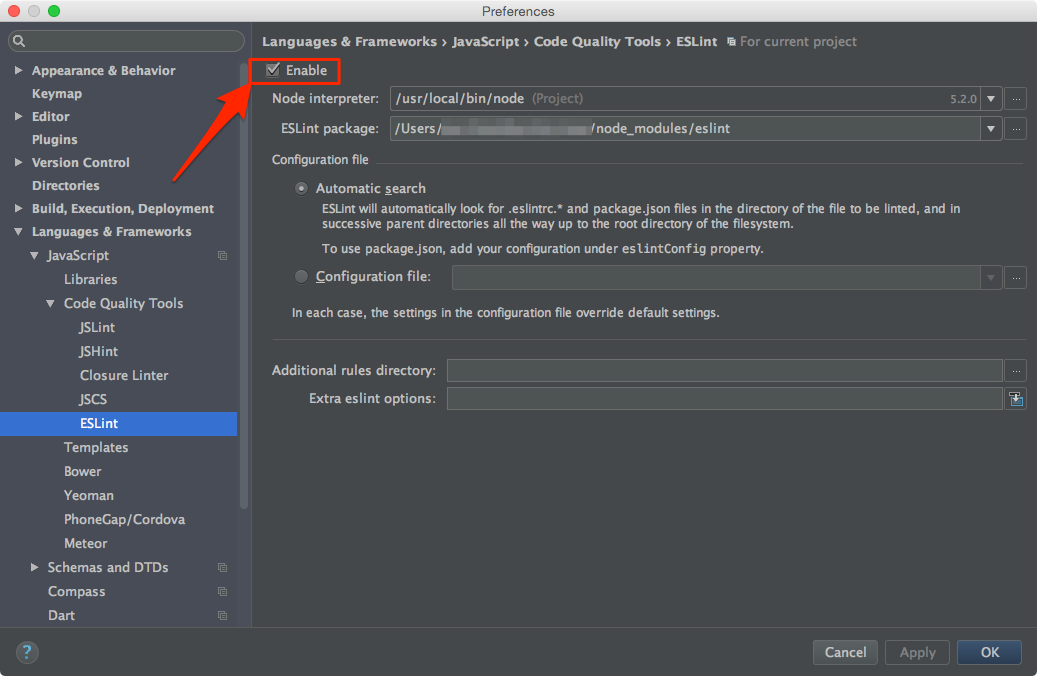
Enable ESLint
ESLint help making all developer follow the same coding format. Please also setting up in your IDE, otherwise, you will fail ESLint test.
- Go to WebStorm Preference
- Search for
ESLint - Click
Enable
Have another question?
Submit an issue, hop onto the Gitter channel or contact Max direct on twitter!